

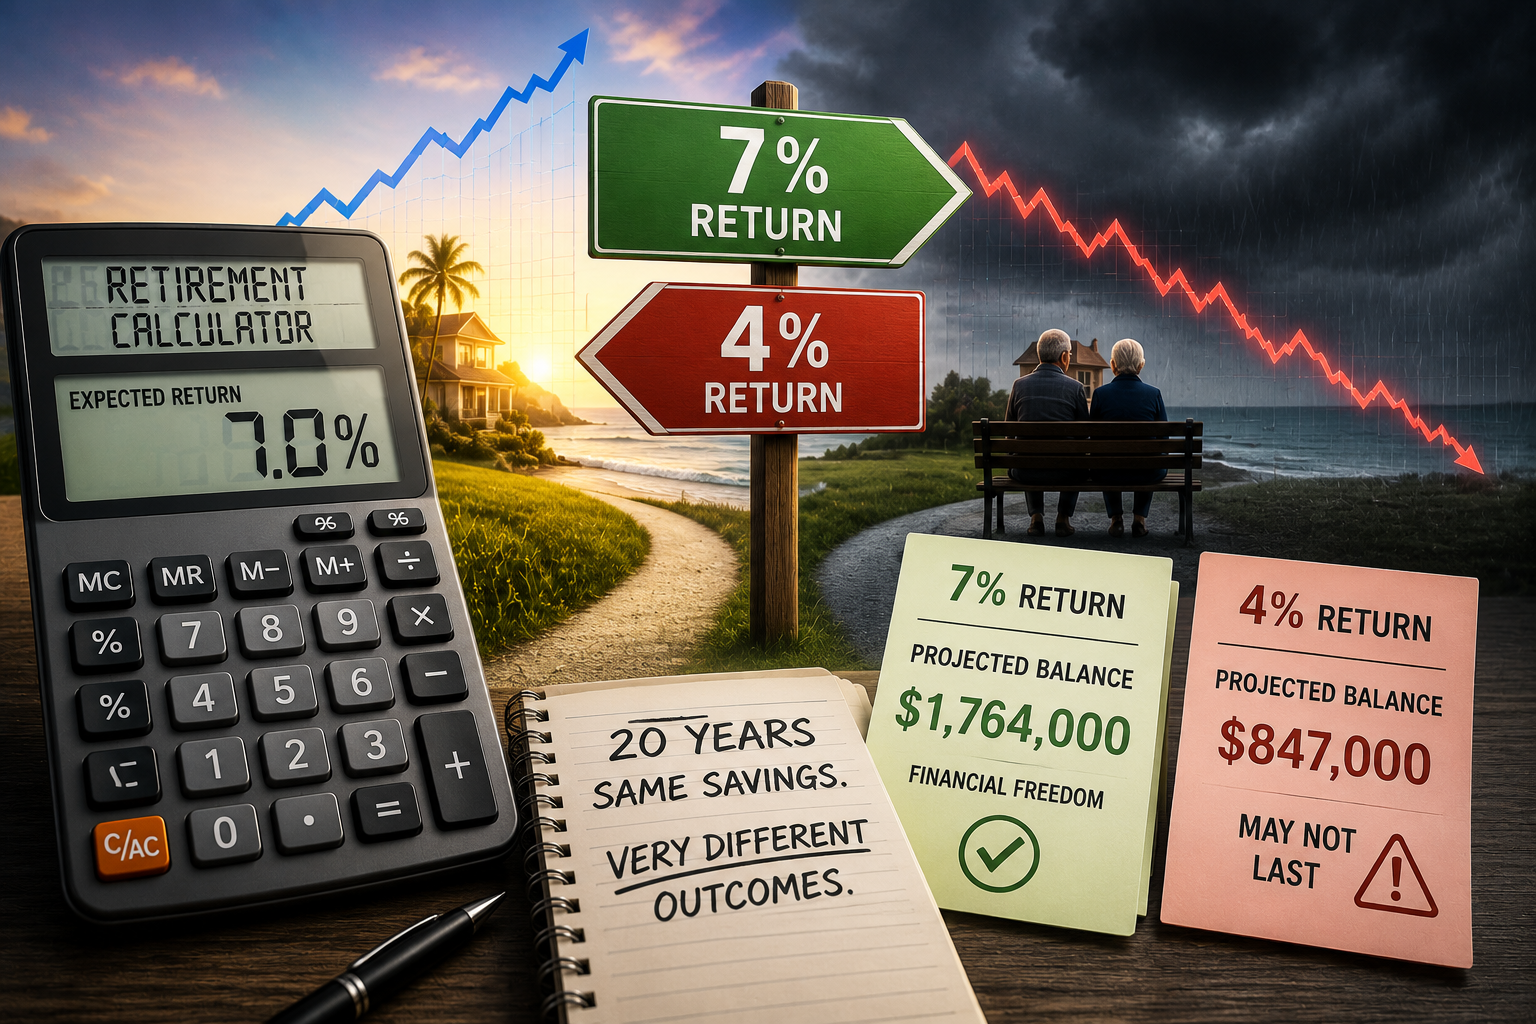

For decades, retirement planning rules of thumb have leaned on the historical average return of the US stock market, often cited loosely as somewhere around 10 percent annually. Forward-looking estimates from Morningstar and other major asset managers now paint a considerably more conservative picture for the next decade, with simulated average nominal returns in the range of 3.5 to 5.5 percent for US equities, well below the long-run historical average. If your retirement plan or savings calculator is still using the old historical figure, it may be quietly overstating how much your current contributions are likely to grow, and understanding the gap matters for anyone planning several decades out.
- Historical vs. Forward-Looking Return Estimates
- Why Forward-Looking Estimates Differ So Much From Historical Averages
- What This Means If You’re Decades From Retirement
- What This Means If You’re Within 10 to 15 Years of Retirement
- Running the Numbers: What the Gap Actually Costs You
- How to Actually Adjust a Retirement Plan for Lower Expected Returns
- Costs Matter More When Returns Are Already Compressed
- Why This Doesn’t Mean Abandoning Stocks
- How International Diversification Fits Into This Picture
- Retirement Savings Doesn’t Exist in a Vacuum
- The Limits of Any Forward-Looking Estimate
- Bottom Line
- Frequently Asked Questions
This isn’t a small rounding difference. As the numbers below show, the gap between a 10 percent assumption and a 5 percent assumption compounds into a genuinely different retirement outcome over a working career, which is exactly why it’s worth spending real time on this rather than treating it as a footnote in a calculator you filled out once and never revisited.
Historical vs. Forward-Looking Return Estimates
| Source | Estimated Annual Return | Time Horizon |
|---|---|---|
| Long-run historical S&P 500 average | Over 10% nominal | Since 1926, various periods |
| Morningstar simulated estimate | Approximately 3.5% to 5.5% nominal | Next 10 years, US equities |
| Vanguard capital markets model | Similarly moderated range | 10-year forward projection |
| Implication for a 7% planning assumption | May be overly optimistic near-term | Especially for shorter horizons |
Why Forward-Looking Estimates Differ So Much From Historical Averages
Forward-looking capital market estimates from firms like Morningstar and Vanguard are not simply extrapolating the past; they are built on models that incorporate current valuations, meaning how expensive stocks currently are relative to earnings and other fundamentals, alongside assumptions about future earnings growth and dividend yields. When valuations are elevated relative to historical norms, as many of these models currently assess US large-cap equities to be, the models tend to project lower forward returns, on the theory that expensive starting points tend to compress the returns available from that point forward, even if the long-run historical average across many decades remains higher.
What This Means If You’re Decades From Retirement
For younger investors with several decades until retirement, a lower return estimate for the next 10 years specifically is less alarming than it might first appear, since these estimates typically apply to a shorter forward window rather than a permanent downward revision to long-run expected returns. A 30-year-old investor has time for market cycles to play out well beyond the next decade, and historically, periods of below-average returns have often been followed by periods of above-average returns as valuations reset. That said, even a temporary decade of lower returns compounds meaningfully over a full career, so it is not something to dismiss entirely even for younger investors with a long runway.
It’s also worth pointing out that a lower expected return on invested money doesn’t change the value of simply having money to invest in the first place. If you haven’t built a real emergency fund or investable savings yet, the return assumption is the wrong thing to worry about first — our guide on how to save $10,000 in one year even on a tight budget is a more useful starting point than optimizing a retirement calculator you can’t yet fund consistently.
What This Means If You’re Within 10 to 15 Years of Retirement
For investors closer to retirement, the next decade’s return environment carries much more direct weight, since it overlaps significantly with the years immediately before and after leaving the workforce, a period sometimes called the sequence of returns risk window because poor returns during this specific stretch can disproportionately affect how long a portfolio lasts. Investors in this window should treat the more conservative estimates as a reason to stress-test their retirement plan under a lower-return scenario specifically, rather than assuming the historical 10 percent figure will simply reassert itself in time to rescue their plan.
Running the Numbers: What the Gap Actually Costs You
Abstract percentage differences are easy to skim past, so it helps to put an actual dollar figure on the gap. Take a simplified example: someone contributing $500 a month for 30 years, with no other changes to the scenario.
| Assumed Annual Return | Approximate Ending Balance After 30 Years |
|---|---|
| 10% (old historical assumption) | Roughly $1,130,000 |
| 7% (a commonly used “moderate” planning figure) | Roughly $610,000 |
| 5% (closer to current 10-year forward estimates) | Roughly $415,000 |
These are simplified, pre-inflation, pre-tax illustrations, not a prediction of what any specific portfolio will do, but the pattern is the point: the gap between a 10 percent assumption and a 5 percent assumption on the exact same contributions isn’t a modest difference, it’s the difference between a retirement plan that comfortably works and one that comes up meaningfully short. This is precisely why financial planners increasingly recommend stress-testing a plan against multiple return scenarios instead of anchoring to a single optimistic number.
How to Actually Adjust a Retirement Plan for Lower Expected Returns
The most direct way to adjust a retirement projection for lower expected returns is to rerun your retirement calculator or plan using a more conservative assumption, something closer to the 5 to 6 percent range for the near-term rather than 8 to 10 percent, and see whether your current savings rate and timeline still produce an adequate outcome under that scenario. If the more conservative projection shows a meaningful shortfall, the available levers are the same ones that always apply: increasing your savings rate, extending your working years modestly, adjusting your asset allocation, or in some cases moderating retirement spending expectations, rather than assuming markets will simply outperform the estimate to close the gap on their own.
If manually rebalancing and stress-testing a portfolio against different return scenarios isn’t something you want to do by hand, it’s worth understanding what the automated alternative actually does before assuming it solves the problem for you. Our breakdown of how robo-advisors actually rebalance a portfolio behind the scenes covers what these tools automate well, and where a lower forward-return environment still requires a human decision about savings rate or timeline that no algorithm can make for you.
Costs Matter More When Returns Are Already Compressed
There’s a detail that gets less attention than the headline return numbers but matters more in a lower-return environment: expense ratios and account fees eat a proportionally larger share of your returns when the underlying returns themselves are smaller. A 0.5 percent annual fee is a rounding error against a 10 percent return; against a 5 percent return, it’s consuming a tenth of your entire gain, every single year, compounding against you the same way returns compound for you.
This is part of why the choice between low-cost index funds and ETFs, and specifically which share class or fund structure you use to hold the same underlying exposure, is worth more scrutiny in the current environment than it would have been when a couple tenths of a percent in fees looked negligible next to double-digit returns. Our comparison of index funds versus ETFs and what actually changes when you pick one over the other walks through the practical differences in cost structure, tax treatment, and trading mechanics that become more consequential once you accept that forward returns may be running well below the historical average.
Why This Doesn’t Mean Abandoning Stocks
A lower return estimate for US equities over the next decade is not an argument for abandoning stock market investing in favor of cash or bonds, since even the more conservative equity estimates in these models generally still exceed the returns expected from safer asset classes over the same period. The purpose of these forward-looking estimates is to inform more realistic planning assumptions, not to suggest that markets have become a poor place to invest relative to the alternatives. Diversifying across US and international equities, since some forward-looking models show relatively more attractive valuations and return potential outside the US market currently, is one adjustment some investors and advisors have made in response to these updated estimates.
How International Diversification Fits Into This Picture
One notable feature of many current forward-looking capital market models is that international equities, particularly in markets outside the United States, are frequently projected to offer relatively more attractive expected returns than US large-cap stocks over the coming decade, largely because international valuations have generally not reached the same elevated levels. This has led some financial advisors and institutional investors to reassess portfolio allocations that had grown heavily concentrated in US equities over the past decade of strong US market performance, considering whether a larger allocation to international markets might improve diversification and expected returns going forward. This is not a guaranteed outcome, since forward-looking models for international markets carry their own uncertainty, but it is a meaningful part of how professional investors are responding to the updated return estimates as a whole.
Retirement Savings Doesn’t Exist in a Vacuum
It’s worth stepping back from the return-assumption question for a moment, because for a lot of households, the more urgent issue isn’t which percentage to plug into a calculator — it’s what’s competing with retirement contributions for the same dollar in the first place. Carrying a balance on high-interest debt tends to cost more than even the optimistic 10 percent historical return could offset, which is why understanding what the record levels of credit card debt in 2026 actually mean for someone carrying a balance is arguably a more urgent read for some households than a deep dive into forward equity return models. As a rule, paying down debt at double-digit interest rates is a more reliable “return” than any equity market projection, optimistic or conservative.
Retirement accounts are also increasingly sharing space with newer savings vehicles competing for the same monthly contribution, particularly for parents. If you’re weighing where extra savings should go, it’s worth understanding how the new Trump Accounts and their 530A structure for kids actually work, and how a Trump Account compares against a 529 plan or a Roth IRA for kids, since the same lower-return environment discussed here applies to whichever account eventually holds that money.
Finally, as retirement savings grow into a meaningful balance, they become a more attractive target for fraud, particularly for older investors closer to drawing down their accounts. It’s worth knowing how to actually spot an imposter scam before sending money, since no amount of careful return modeling protects a retirement account from a single successful fraud attempt.
The Limits of Any Forward-Looking Estimate
It is worth holding these estimates with appropriate humility, since forward-looking capital market assumptions from any single firm, including well-regarded ones like Morningstar and Vanguard, have been wrong before in both directions, sometimes significantly so. These figures are best used as one input for stress-testing a retirement plan under a range of scenarios rather than treated as a precise forecast of what will actually happen. A retirement plan that holds up reasonably well under both an optimistic historical-average scenario and a more conservative forward-looking scenario is more robust than one built entirely around a single point estimate from any one source.
Bottom Line
Recent forward-looking estimates from Morningstar and similar firms suggest US equity returns over the next decade could run meaningfully below the roughly 10 percent long-run historical average, closer to a 3.5 to 5.5 percent range. This matters most for investors within 10 to 15 years of retirement, who should stress-test their plans against a more conservative assumption, while younger investors with a longer runway have more time for return cycles to average out, without needing to abandon equity investing altogether in response. Just as important as the assumption itself is what else is competing for those same dollars — high-interest debt, competing savings goals, and unnecessary fees all matter more, not less, in a lower-return environment.
Frequently Asked Questions
Does a lower 10-year return estimate mean the stock market is a bad investment now?
No. These estimates are relative to historical averages and specific to a 10-year window, not a signal that equities have become unattractive compared to other asset classes, which these same models generally project to return even less over the same period.
Should I move my retirement savings out of stocks because of these estimates?
Most financial professionals would caution against a wholesale shift out of equities based on a single forward-looking estimate. These figures are better used to stress-test your existing plan than to justify a dramatic allocation change.
Why do different firms produce different return estimates?
Each firm uses its own proprietary model, incorporating different assumptions about valuations, earnings growth, and economic conditions, which is why estimates from Morningstar, Vanguard, and other firms can differ somewhat even when directionally similar.
How often do these forward-looking estimates get updated?
Most firms update their capital market assumptions at least annually, and sometimes more frequently, as market valuations and economic conditions change.
Should I pay off debt or keep investing if forward returns are lower than expected?
Generally, high-interest debt, particularly credit card balances, carries an interest rate well above even the optimistic historical equity return, so paying it down typically outperforms investing on a risk-adjusted basis regardless of which return estimate you use. Lower forward equity estimates make this comparison even more lopsided in favor of debt payoff first.
Is it worth paying for a financial advisor just to stress-test my retirement plan against these numbers?
Not necessarily. Many retirement calculators let you manually adjust the assumed return, and running your own numbers at both a conservative and an optimistic assumption is something most people can do without paid help. An advisor becomes more valuable when your situation involves more complexity, such as multiple accounts, tax considerations, or a shorter timeline where the stakes of getting it wrong are higher.
This article is for general informational purposes only and is not financial or investment advice. Forward-looking return estimates are projections, not guarantees, and actual market performance may differ significantly. The dollar illustrations in this article are simplified estimates for educational purposes and do not account for taxes, fees, inflation, or market volatility. Consult a qualified financial advisor for personalized retirement planning.