
You opened a brokerage account, made your first investment, and received a statement. Now you are staring at a document full of abbreviations, columns, and numbers you are not sure how to interpret.
- The Main Sections of a Brokerage Statement
- Section 1: Account Summary
- Section 2: Cash and Cash Equivalents
- Section 3: Holdings / Positions
- Section 4: Unrealised vs Realised Gains and Losses
- Section 5: Transaction History
- Section 6: Dividends and Income
- How to Calculate Your Real Return From the Statement
- What to Review Monthly vs Annually
- Common Terms and Abbreviations Decoded
- Frequently Asked Questions
- Key Takeaways
You are not alone. Brokerage statements are genuinely confusing for most new investors, and the financial industry has done little to simplify them. This guide walks through every section of a typical brokerage statement so you know exactly what you are looking at, what matters, and what you can safely ignore.
The Main Sections of a Brokerage Statement
Most brokerage statements from major providers (Fidelity, Schwab, Vanguard, Interactive Brokers, and others) follow a similar structure. Here are the main sections you will encounter:
| Section | What It Covers |
| Account Summary | Your total portfolio value and change since last statement |
| Cash and Cash Equivalents | Uninvested cash, money market balance |
| Holdings / Positions | All the securities you currently own |
| Transaction History | Every buy, sell, deposit, withdrawal, dividend |
| Realised Gains and Losses | Profit or loss on investments already sold |
| Unrealised Gains and Losses | Paper profit or loss on holdings you still own |
| Dividends and Income | Payments received from holdings during the period |
| Fees | Any charges applied to your account |
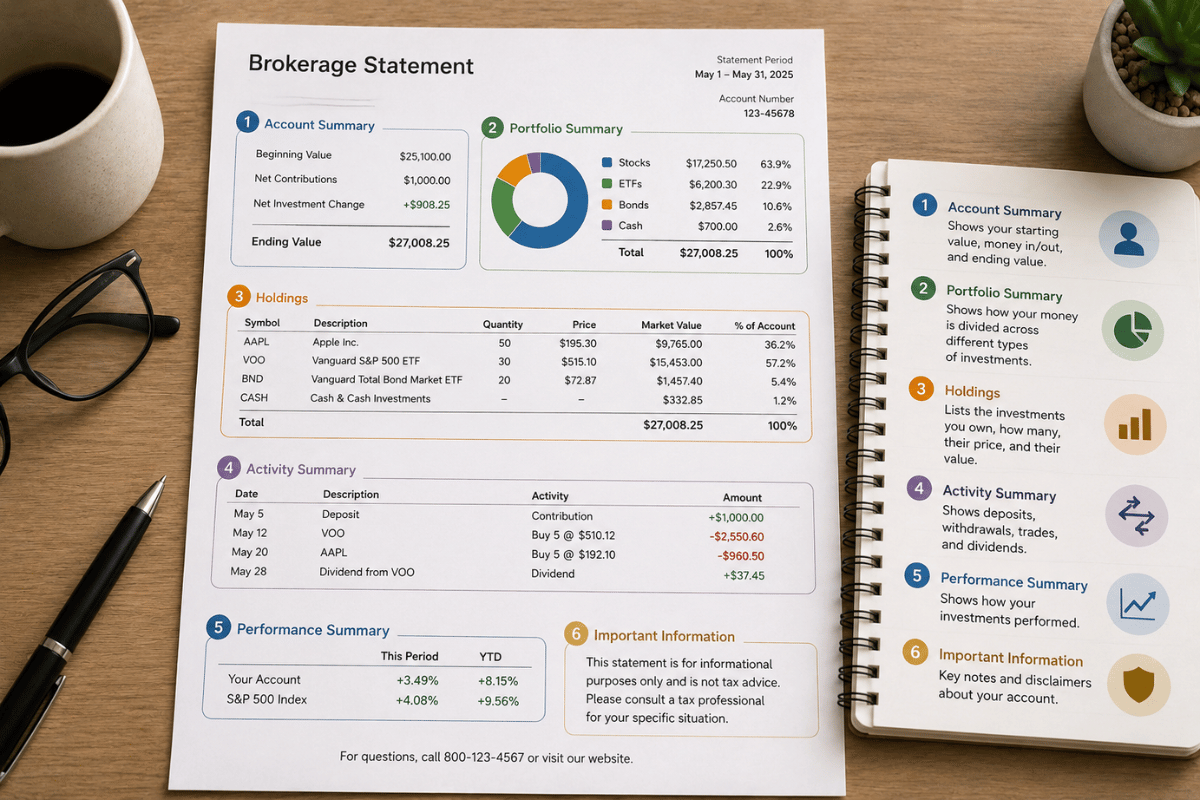
Section 1: Account Summary
This is the first page and the top-level snapshot of your account. It shows:
- Total Account Value: The current market value of everything you hold, including cash. This is the most important single number on the statement.
- Change in Value: How much your account gained or lost since the last statement period (usually the previous month or quarter).
- Net Contributions: How much new money you added or withdrew during the period.
- Net Change from Investment Activity: The gain or loss that came from your investments moving in value, separate from money you put in.
| Why This Distinction Matters Example: Your account grew from $10,000 to $10,800 this month. You also deposited $500 during the month. Total change: +$800 Net contributions: +$500 Investment gain: +$300 (the actual return from market movement) Without separating contributions from returns, you might think you earned $800. Your actual investment return was $300, or approximately 3% on your $10,000. |
Section 2: Cash and Cash Equivalents
This shows uninvested cash sitting in your account. Uninvested cash earns little or nothing in most standard brokerage accounts, though some brokers now pay competitive rates on cash sweeps into money market funds.
If you see a significant cash balance that you did not intentionally keep as cash, check whether dividends or sale proceeds have accumulated without being reinvested. Uninvested cash is a drag on long-term returns.
Section 3: Holdings / Positions
This is the most important section of the statement for active monitoring. It lists every security you own. Here is what each column means:
| Column Label | Plain English Meaning |
| Symbol / Ticker | The short code identifying the security (e.g. VOO, AAPL) |
| Description | The full name of the fund or company |
| Shares / Units | How many shares or units you own |
| Price | The current market price per share |
| Market Value | Shares x Price = what your holding is worth today |
| Cost Basis | What you paid for the holding in total |
| Unrealised Gain/Loss | Market Value minus Cost Basis (profit or loss if you sold today) |
| Unrealised Gain/Loss % | The percentage return on this holding to date |
| % of Portfolio | What proportion of your total account this holding represents |
Understanding Cost Basis
Cost basis is what you paid for your investment, including any transaction fees. It is the starting point from which your gain or loss is calculated. If you have made multiple purchases of the same security over time (dollar-cost averaging), your cost basis is typically the average price paid across all purchases.
Cost basis matters enormously for tax purposes. When you sell an investment, your taxable gain is the sale price minus the cost basis. Keeping accurate cost basis records avoids overpaying tax.
Average Cost vs FIFO
Two main methods are used to calculate cost basis when you have bought shares in multiple batches:
- Average Cost: Your total purchase amount divided by total shares. Simple and commonly used for mutual funds.
- FIFO (First In, First Out): Assumes you sell the shares you bought first. Used by default in many brokerages for individual stocks and ETFs.
Your brokerage will state which method it uses. This affects how much capital gains tax you pay when you sell, so it is worth understanding.
Section 4: Unrealised vs Realised Gains and Losses
This is one of the most misunderstood concepts for new investors.
Unrealised Gains and Losses
An unrealised gain or loss is a paper profit or paper loss on investments you still hold. If you bought 10 shares at $100 each and they are now worth $120 each, you have an unrealised gain of $200. You have not made that money yet because you have not sold. The number is notional.
You do not pay tax on unrealised gains. They can reverse if the price drops back down. They become real only when you sell.
Realised Gains and Losses
A realised gain or loss occurs when you sell an investment. At the moment of sale, the gain or loss becomes real and, in most countries, becomes taxable.
| Type | When It Happens | Tax Consequence |
| Unrealised Gain | You hold an investment worth more than you paid | No tax until you sell |
| Realised Gain | You sell an investment for more than you paid | Usually taxable in the year of sale |
| Unrealised Loss | You hold an investment worth less than you paid | No tax consequence yet |
| Realised Loss | You sell for less than you paid | May offset realised gains (tax-loss harvesting) |
Section 5: Transaction History
This section records every transaction in your account during the statement period: purchases, sales, dividends received, interest, and any fees charged.
Review this section each month to verify:
- All dividend payments were received for holdings you expect to pay dividends
- No unauthorised transactions appear
- Automatic investments or contributions processed correctly
- Any fees charged match what you expect from your account agreement
Common transaction codes you will encounter:
| Code / Label | Meaning |
| BUY | Purchase of a security |
| SELL | Sale of a security |
| DIV | Dividend payment received |
| INT | Interest payment received |
| REINV | Dividend automatically reinvested in more shares |
| FEE | Account fee or commission charged |
| XFER IN / XFER OUT | Transfer of funds or securities in or out of account |
| ACH | Automated bank transfer (deposit or withdrawal) |
Section 6: Dividends and Income
This section shows dividends, interest, and other income received during the statement period. It is separate from capital gains (gains from shares rising in value).
Dividends are payments made by companies or funds to shareholders, typically quarterly. If you have selected dividend reinvestment (DRIP), you will see dividends listed here along with a REINV transaction showing the additional shares purchased.
Dividends are typically taxable income in the year received, even if automatically reinvested. Your annual tax statement (1099-DIV in the US, similar documents elsewhere) will summarise this for tax filing purposes.
How to Calculate Your Real Return From the Statement
The total account value change is not your investment return. New contributions inflate the number. Here is how to calculate a more meaningful return:
- Note starting value at the beginning of the period
- Note ending value at the end of the period
- Note total net contributions (deposits minus withdrawals) during the period
- Investment gain = Ending Value minus Starting Value minus Net Contributions
- Return % = Investment Gain divided by Starting Value
| Return Calculation Example Starting value: $25,000 Ending value: $27,400 Net contributions: $1,500 (deposited during period) Investment gain: $27,400 – $25,000 – $1,500 = $900 Return: $900 / $25,000 = 3.6% for the period Without removing contributions, the naive calculation shows 9.6% growth, which significantly overstates actual investment performance. |
What to Review Monthly vs Annually
Review Monthly
- Account total value and change
- Transaction history for accuracy
- Dividend payments received
- Any unexpected fees
Review Annually (Full Audit)
- Overall portfolio return versus your target benchmark
- Asset allocation: has it drifted from your target?
- Cost basis records for any securities you plan to sell
- Tax documents for the previous year: 1099, K-1, or regional equivalent
- Beneficiary designations still current
- Total fees paid in the year
Common Terms and Abbreviations Decoded
| Term | Plain English |
| NAV | Net Asset Value: the price per unit of a fund calculated once daily |
| AUM | Assets Under Management: total value the firm manages |
| Expense Ratio | Annual fee charged by a fund, expressed as a % of assets |
| 12b-1 Fee | Marketing fee charged by some mutual funds (avoid these) |
| CUSIP | A unique identifier for a security (US/Canada) |
| ISIN | International version of the unique security identifier |
| Ex-Dividend Date | The date you must own shares by to receive the next dividend |
| Settlement Date | When a trade officially completes (usually 2 business days after trade) |
| Margin | Borrowed money from the broker used to invest. Increases risk significantly. |
| Short Position | A bet that a security’s price will fall. Advanced and high-risk. |
Frequently Asked Questions
How often should I look at my brokerage statement?
Monthly review is sufficient for most investors. Checking too frequently, especially during volatile markets, increases the temptation to make emotional decisions. Research shows that investors who check their portfolios less frequently tend to make fewer costly reactive trades.
My portfolio is down. Should I be worried?
A decline in your portfolio value is normal and expected in any given short period. Markets have always declined temporarily and recovered over time. The relevant question is whether your asset allocation still matches your goals and timeline, not whether the number is currently lower than last month.
What is the difference between a brokerage statement and a trade confirmation?
A trade confirmation is sent immediately after each individual transaction, confirming the details of that specific trade. A brokerage statement is a periodic summary (monthly or quarterly) of your entire account. Both are important: use trade confirmations to verify individual trades and statements to monitor the overall account.
Do I need to keep brokerage statements?
Yes. Keep statements until at least three years after you sell any holding in the account, as you may need cost basis information for tax purposes. Keeping digital copies indefinitely is practical and recommended. Your brokerage typically holds statements online for seven or more years, but personal copies are a good backup.
Key Takeaways
| Summary: How to Read a Brokerage Statement Account Summary shows total value and whether growth came from contributions or investment returns. Holdings section shows what you own, what you paid, and what it is worth now. Unrealised gains are paper profits. You pay no tax until you sell. Transaction history verifies every buy, sell, dividend, and fee in the period. Calculate real return by removing contributions from the value change. Review monthly for accuracy. Review annually for allocation, fees, and tax preparation. |
A brokerage statement becomes less intimidating once you know what each section represents. The most important habit is reviewing it regularly, enough to catch errors and monitor progress, but not so frequently that short-term fluctuations drive emotional decisions. Stay consistent, stay informed, and let your investments do their work.
Disclaimer

The content on Next Future Finance is for informational and educational purposes only and does not constitute financial, investment, or legal advice. Always consult a qualified financial professional before making any financial decisions. Individual results may vary.